The United States and Scandinavia: A Comparison

**Note: I wrote an updated version of this in Jan 2020 to include all the Nordics. You can read it here.

During the May 3 edition of “This Week,” Sen. Bernie Sanders told George Stephanopoulos, “If we know that in countries in Scandinavia, like Denmark, Norway, Sweden, they are very democratic countries obviously; their voter turnout is a lot higher than it is in the United States.  In those countries, health care is a right of all people.  In those countries, college education, graduate school is free.  In those countries, retirement benefits, childcare are stronger than in the United States of America.  And in those countries by and large, government works for ordinary people in the middle class, rather than, as is the case right now in our country, for the billionaire class.”  Stephanopoulous responded, “I can hear the Republican attack ad right now; ‘he wants America to look more like Scandinavia’.”  Sanders was okay with that, arguing, “That’s right.  That’s right.  What’s wrong with that?  What’s wrong when you have more income and wealth equality.  What’s wrong when they have a stronger middle class in many ways than we do, a higher minimum wage than we do and they’re stronger on the environment than we are.”  Sanders went on to say that there is nothing wrong with learning to other countries.  The portion begins around 1:40 of the video clip–

It is in that spirit that I set out to compare the U.S. and Scandinavia on a number of topics, including some of those mentioned by Sen. Sanders.

GDP per capita (2013)
a) Denmark: $59,818.60; b) Norway: $100,898.40; c) Sweden: $60,380.90; d) United States: $53,042.00

Individual Income Tax Rate (2014)
a) Denmark: 55.41%; b) Norway: 47.2%; c) Sweden: 57%; d) United States: 39.6%

Unemployment Rate (2013)
a) Denmark: 7.0%; b) Norway: 3.5%; c) Sweden: 8.1%; d) United States: 7.4%

Income Inequality (Gini Coefficient- the closer to 1, the greater the inequality, 2011)
a) Denmark: .253; b) Norway: .250; c) Sweden: .273; d) United States: .389

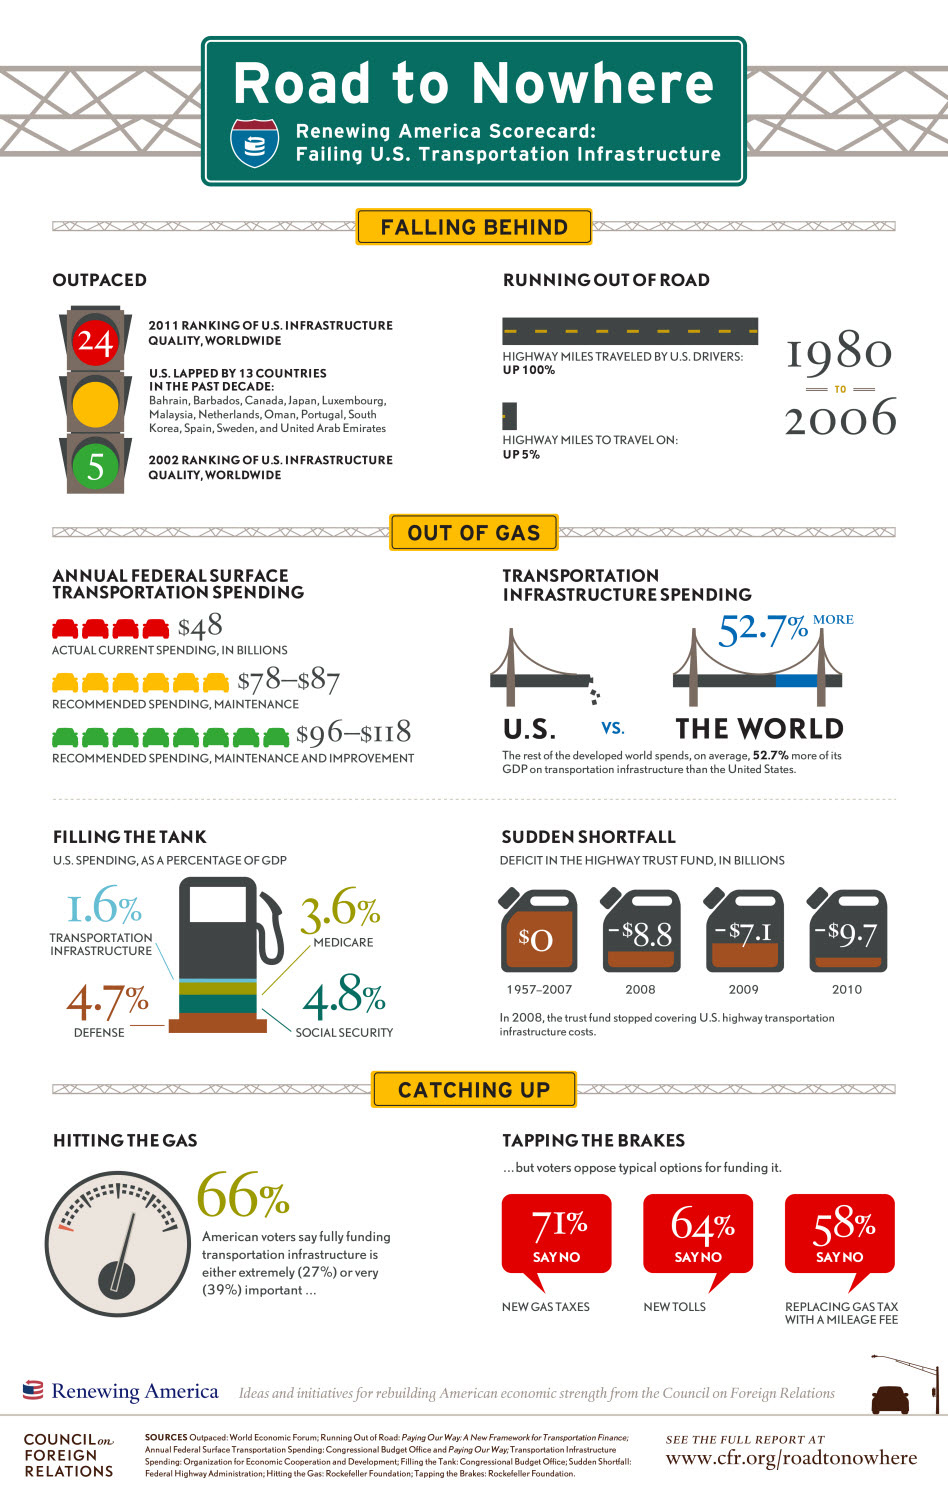
Quality of Overall Transport Infrastructure (Rank out of 144; 2014)
a) Denmark: 15; b) Norway: 28; c) Sweden: 18; d) United States: 16

Public Investment on Infrastructure (% of GDP; 2014)
a) Denmark: 3.4%; b) Norway: 3.3%; c) Sweden: 4.5%; d) United States: 4.1%

Total Paid Leave for Mothers (in weeks; 2014)
a) Denmark: 50; b) Norway: 81; c) Sweden: 60; d) United States: 0

Paid Leave Reserved for Fathers (in weeks; 2014)
a) Denmark: 2; b) Norway: 14; c) Sweden: 10; d) United States: 0

Public Spending on Education- Primary, Secondary, and Tertiary (% of GDP, 2011)
a) Denmark: 7.0%; b) Norway: 6.2%; c) Sweden: 6.0%; d) United States: 4.9%

Public Expenditure for Childcare and Early Education (% of GDP; 2014)
a) Denmark: 2.0%; b) Norway: 1.2%; c) Sweden: 1.6%; d) United States: 0.4%

Cost of Childcare, Couples (% of average wage; 2014)
a) Denmark: 11.9%; b) Norway: 14.9%; c) Sweden: 5.8%; d) United States: 35.1%

Mean Score in PISA (2012)
a) Denmark: 500; b) Norway: 489; c) Sweden: 478; d) United States: 481

Poverty Rates for Children (2010)
a) Denmark: 3.7%; b) Norway: 5.1%; c) Sweden: 8.2%; d) United States: 21.2%

Voter Turnout (2013 or latest available year)
a) Denmark: 87.74%; b) Norway: 78.23%; c) Sweden: 84.63%; d) United States: 66.65%

Environmental Performance Index (Rank out of 178; 2014)
a) Denmark: 13; b) Norway: 10; c) Sweden: 9; d) United States: 33

Health Care Ranking (out of 11 countries, 2014)
a) Denmark: Not part of the study; b) Norway: 7; c) Sweden: 3; d) United States: 11

Life Expectancy (2014)
a) Denmark: 79.9 years; b) Norway: 81.4 years; c) Sweden: 81.9 years; d) United States: 78.7

Corruption Perceptions Index (Rank out of 175; 2014)
a) Denmark: 1; b) Norway: 5; c) Sweden: 4; d) United States: 17

Press Freedom Score (0 is the most free; 2015)
a) Denmark: 12; b) Norway: 10; c) Sweden: 10; d) United States: 22

Life Satisfaction (10 is most satisfied; 2014)
a) Denmark: 9.4; b) Norway: 9.7; c) Sweden: 8.9; d) United States: 7.5

Since Denmark, Norway, and Sweden do not have laws for a minimum wage, I did not include that data.

While the list of indicators is not exhaustive and does not give a complete picture of life in these countries, it would appear Sen. Sanders is on to something here.  The question now is- what can U.S. policymakers learn from these countries?

To learn more about the three Scandinavian countries in general, check out their embassy websites:

Thanks for reading.

Why You Should Care About US Infrastructure

Even before he announced his candidacy for President, Sen. Bernie Sanders touted a plan for America’s infrastructure.  His bill, the Rebuild America Act of 2015, would cost around $1 trillion and create and maintain 13 million jobs.  It seems like a hefty price tag, but given the fact that the infrastructure in the U.S. is crumbling, it is well worth it.

The Current State of America’s Infrastructure
Back in June 2012, the Council on Foreign Relations released “Road to Nowhere,” a progress report on US infrastructure.  While the report is short and informative, the infographic sums up the message nicely:

Infrastructure_Scorecard_5


When we compare the U.S. with our counterparts in the OECD, the results are not good for America; however, things have improved since the report.  According to the OECD’s “2015 Going for Growth,” U.S. spending as a percent of its GDP has increased to 4.1% (the OECD average is 3.5%).  Additionally, the World Economic Forum’s Global Competitiveness Index ranked the overall quality of U.S. infrastructure  at 16th (we were 24th in 2012).  While that is illustrative of improvement here, it is surely still not what one might expect from the world’s largest economy (based on GDP).

Perhaps one of the best places to look for information on all of this is the “2013 Report Card for America’s Infrastructure” from the American Society of Civil Engineers.  While the ASCE stands to benefit from building and maintaining our infrastructure, the U.S. report card and the Wisconsin state report card are still good gauges.  Here are just a few of the pieces of information I found that highlight the need for improvement:

  • In some places, pipes and mains for drinking water are more than 100 years old (p. 5)
  • “One in nine of the nation’s bridges are rated as structurally deficient.” (p. 6)  This means that they are restricted to light vehicles, closed to traffic, or require rehabilitation.  In Wisconsin, 8.5% of the bridges fit this description.
  • Schools do not have the funding they need for construction and maintenance. In Wisconsin, schools had “$4.4 billion in infrastructure funding needs.”
  • Wisconsin has fifty-five sites on the National Priority List.  These are sites that “release or threaten the release of hazardous substances, pollutants, or contaminants.” (p. 21)
  • “32% of America’s major roads are in poor or mediocre condition, costing U.S. motorists…$67 billion a year.” (p. 21)
  • “42% of America’s major urban highways remain congested, costing the economy an estimated $101 billion in wasted time and fuel annually.” (p. 48)  The ASCE estimates the fuel lost at 1.9 billion gallons.
  • “45% of American households lack any access to transit.” (p. 51)
  • The U.S. electric grid has facilities dating back to the 1880s (p. 60, italics mine)

Funding
The main reason the U.S. has problems with its infrastructure is funding.  As noted above, spending has increased since 2012, but it is still not enough.  In their report on creating a national infrastructure bank, the Center for American Progress highlights four main problems with funding and investment:

  • Failure to provide sufficient public funds
  • Failure to attract private investment
  • Failure to coordinate investments
  • Failure to allocate funds efficiently (p. 4, NIB)

If the lack of funding is not addressed (and therefore infrastructure is not maintained), the ASCE estimates “by 2020, the economy is expected to lose almost $1 trillion in business sales, resulting in a loss of 3.5 million jobs.” (p. 5, “Failure to Act: The Impact of Current Infrastructure Investment on America’s Economic Future“)  They’ve even created a nice infographic on the topic:

Investing in Infrastructure


The U.S. government cannot keep putting off funding and investing in infrastructure.  At the current rate, the funding gap is projected to be just over $1 trillion by 2020 and almost $4.7 trillion by 2040. (p. 7, Failure to Act).

Economic Impact
If you’re still not convinced about the need for massive reform concerning U.S. infrastructure, maybe some figures on the economic impact will help.  It is important to remember that lack of funding and investment for infrastructure negatively affects “business productivity, GDP, employment, personal income, and international competitiveness.” (p. 4, Failure to Act)  In other words, crumbling infrastructure affects trade.  If trade is affected, then jobs are also affected.  If jobs are affected, personal income is affected.  Delays in shipping goods (whether on the surface, waterways, or in the air) to markets increases the cost of those goods.  If the cost of goods goes up, disposable income goes down.  At the current rate, U.S. households can expect “an average loss of more than $3,000 per year through 2020 in disposable income.” (p. 7, Failure to Act)

In 2010, 76% of U.S. exports and 70% of imports arrived via ports (p. 41, Report Card).  If the roads, rail system, and inland waterways to ports (as well as other modes of transportation) are not sufficient to handle the movement of goods, it could spell economic trouble.  Ports are an important part of the Wisconsin economy, as they handle approximately $2.4 billion in goods every year.

Screen Shot 2015-05-13 at 1.49.41 PM

Additionally, “deficient and deteriorating transit systems cost the U.S. economy $90 billion in 2010” (p. 51, Report Card).  Improving and increasing transit systems would help those without access to automobiles get to places of employment or stores.  Additionally, passenger rail helps decrease wear and tear of roads, as well as reduce congestion of roads and highways.

Undertaking a massive plan to overhaul U.S. infrastructure not only helps businesses and trade, it also helps workers.  According to a recent report from the Brookings Institution, “every $1 billion in highway spending can directly and indirectly create up to 13,000 jobs a year.”  Additionally, many infrastructure jobs have low barriers to entry, which makes it easier for workers without a four-year college degree to find employment.  Since infrastructure workers do, however, need recruiting and training, this is an opportunity for technical colleges to offer more programs.

Time to Rebuild America
It should be clear that the U.S. has a lot of work to do to improve its infrastructure.  The ASCE Report Card argues that “America’s infrastructure needs bold leadership and a compelling vision at the national level” (p. 9).  Out of the major presidential candidates who have officially announced their candidacy, only Bernie Sanders has a plan- the Rebuild America Act.  His bill calls for funds to be allocated to the following areas:

  • The Highway Trust Fund (which is about to run out of money)
  • Intercity Passenger and High-Speed Rail
  • Transportation Infrastructure Finance and Innovation
  • Airport Improvement
  • Next Generation Air Transportation System
  • National Infrastructure Investments
  • State Water Pollution Control Revolving Funds
  • State Drinking Water Treatment Revolving Loan Funds
  • Water Infrastructure Finance and Innovation
  • Non-Federal Dams and Levees
  • Inland Waterways
  • Harbor Maintenance
  • Dams and Levees
  • The National Park Service
  • The Broadband Initiatives Program
  • The Broadband Technology Opportunities Program
  • The Electric Grid

The bill also called for a National Infrastructure Bank, which would help address the problems with funding and investment I mentioned above.  I look forward to the Senator expanding on his plan in the coming months.

What are your thoughts?  Should the U.S. be worried about its infrastructure, or are the ASCE and other organizations blowing things out of proportion?  Thanks for reading.

Letter in Opposition to AB 194

On May 4, Wisconsin state legislators introduced AB 194, a bill that will require students to take a civics test (based on the U.S. Citizenship Test) in order to receive their high school diploma.  I have read the bill, and I am against it.  What follows is the text of the letter I sent today to the sponsors, my representative, and the chair and co-chair of the Committee on State Affairs and Government Operations.  What do you think- should graduating high school seniors be required to take the civics test?

Thanks for reading.

Dear ,

I am writing to you in opposition to AB 194, which “requires a person to correctly answer at least 60 of 100 questions on a civics test, which is identical to the civics test required to be taken by persons seeking U.S. citizenship, as a prerequisite to obtaining a high school diploma or a high school equivalency diploma.” Requiring a civics test will not make a student more patriotic or more of a citizen, nor will it lead to a sound understanding of our government.

Tests such as the one that would be required by this bill require only rote learning. As a high school social studies teacher, I do not want my students to memorize random facts; I aim to have them perform tasks that require higher order thinking. By requiring purely memorization, this bill goes against sound pedagogical standards.

Instead of encouraging students to learn random facts about the United States, we should be encouraging them to be involved and to vote. We should have lengthy discussions on topics like campaign finance, the role of public opinion, and polarization in politics. We should teach them how to conduct research on policies and candidates so that they can make informed decisions at the polls. We should talk about the abysmal voter turnout in the 2014 midterms and why people did not vote. We should be discussing the problems of our current system and their ideas for addressing them. By requiring students to have only rudimentary knowledge of our political system, this bill will not lead to a more informed and engaged electorate.

I am not saying that students should not know the basics of our government. They should know who represents us in Congress, and they should understand the rights guaranteed in the Bill of Rights. They should not, however, be required to take a test to showcase this knowledge. This test will do nothing to help students become active participants in the political process.

Thank you for your time and consideration.

Sincerely,

Jason Knoll

Thoughts on the UK Parliamentary General Election

My first exposure to the UK Parliamentary General Election was in 2010.  That year, I showed one of the leaders debates to my classes to have them compare it with our presidential debates.  This year, I showed the first leaders debate (April 2) to one of my classes, again for the same purpose.  While I followed the 2010 election out of my interest in European politics, I have followed the 2015 election a bit more closely, as I will be teaching about the UK in a new class next year.  As I strive to get a better understanding of the electoral process, I wanted to share some thoughts I’ve had since that first debate.

First, I am surprised at the brevity of the campaign.  Thanks to Giles Goodall, a candidate for the LibDems, I learned that there is a short campaign (which starts when Parliament is dissolved) and a long campaign (which began back in December).  This handout from the UK Electoral Commission explained it nicely.  Compared with the U.S., this is a short time for campaigning;  even our campaigns for the House of Representatives last longer.  I wonder what Britons make of the length of our presidential campaigns.

Second, campaign finance is much different there than here in the U.S.  To see how much they are limited to, I’ll refer you to the aforementioned handout form the Electoral Commission.  During the long campaign, a candidate is limited to a fixed amount of £30,700 plus a variable amount of 6p/9p (100p in a British pound) per elector in a borough/county constituency.  In U.S. dollars, that’s a fixed amount of $46,565.76.  The variable amount is based on the number of electors in the constituency.  According to the Electoral Statistics for UK, 2014, “The typical size of constituencies differs between the constituent countries of the UK with a median total parliamentary electorate across constituencies of about 71,000 in England, 68,900 in Scotland, 67,500 in Northern Ireland and 55,100 in Wales.”  So, if I am a candidate in England, using the median, my variable amount for a borough would be just over $6700 (British readers, please correct me if I am incorrect, my knowledge of the British Pound is minimal, thanks).  That means that I would be able to spend just over $53,000 from December 19, 2014, through March 30, 2015 (the earliest start of a short campaign).  The amount for the short campaign, which lasts until the election on may 7, 2015, is much less than that amount.  Now, let’s keep in mind that elections occur every five years, not two for the U.S. House.  Can you imagine trying to run a campaign for the U.S. House, for which the term of office is shorter, on that little amount of money?

Stephen Castle wrote a fascinating piece about campaign finance for UK elections and made some comparisons to here in the U.S.  At one point he quotes a professor who “said the American system was seen in Britain ‘as the worst of all worlds,’ focused on ‘raising money and not about getting ideas across’.”  While I certainly agree that campaign finance is a massive problem for American politics, it was the point about ideas that stuck with me.  Once the long campaign begins, candidates have just under five months to get their ideas across.  Is that enough time for a serious discussion of the issues?  On the other hand, does the length of the American extremely-long campaign dilute the discussion of ideas?

Finally, I appreciate the fact that the televised debates included more than two leaders.  Yes, the primary debates here may included multiple candidates, but I would like to see a presidential debate that included more than just the two GOP and Democratic candidates.  Along these lines I learned about a program titled, “BBC Question Time,” (thanks to John McManus).  The program is described as “a popular current affairs discussion programme which aims to give people an opportunity to scrutinise directly senior politicians and others who exercise power and influence at a UK level.”  Every week, a studio audience gets to actually pose questions, in person, to MPs; what a wonderful concept!  We need something like that here in the U.S. to publicly hold our elected officials accountable.

In short, I think there are some great ideas concerning campaign finance and publicly questioning politicians that perhaps we should look at further here in the U.S.  If you live in the UK, I would be especially keen on hearing your thoughts on this, even if it is just to correct an error in my analysis.

Thanks for reading.

Bernie Sanders’ Press Conference

Sen. Bernie Sanders held a press conference today to discuss the some of the big issues facing the U.S. and his ideas to address them as a presidential candidate.  It was a short conference- about ten minutes- but within that time, Sen. Sanders impressed me once more with his passion and his stances on the issues.  Here’s a quick rundown–

The economy: I really like how he described the current problem of income inequality as immoral.  He also called our current economic trajectory “unsustainable.”

Campaign finance: Billionaires should not be able to buy elections and/or candidates.  I hope that he will live up to the point that his campaign will make its money from small individual contributions via his website.  According to the National Institute on Money in State Politics, in 2012, Sen. Sanders had $4.1 million in unitemized donations (i.e. donations in the amount of less than $200).  That’s an impressive grassroots fundraising effort.

Climate change: Big goal of the U.S. leading the world away from fossil fuels, and towards energy efficiency and sustainability.

Infrastructure: To help fight unemployment in the U.S., he has a plan that would create and maintain (that’s the key) 13 million jobs.  I highly recommend looking at the 2013 Report Card for America’s Infrastructure from the American Society of Civil Engineers for more information on the current status of our crumbling infrastructure.

College affordability: Students are graduating college with staggering amounts of debt.  Sen. Sanders would like to make public universities tuition-free, similar to Germany.  As a result of rising tuition costs, university education has become more of a privilege than a right.  Here in Wisconsin, four years at the flagship public university, the University of Wisconsin-Madison, will cost students almost $100,000.

Screen Shot 2015-01-20 at 3.36.53 PM

Campaigns: I agree with him that we need serious debates over serious issues.  I also appreciate that he does not go negative in his campaigns.  He also emphasized that disagreement is part of democracy and that he runs “vigorous campaigns.”  After his press conference ended, Hillary Clinton’s campaign sent out a tweet welcoming Sen. Sanders to the race; he gave an excellent reply–

Screen Shot 2015-04-30 at 2.10.54 PM

Based on this press conference, and other speeches and articles, I can confidently declare that I support Sen. Sanders in his run for the presidency.

Thanks for reading.

**Thanks to J.T. Stepleton for the information on unitemized donations.